Text Encoding

Monday, December 8th, 2014

In This week’s lab session we looked at how Text Encoding has been used to enrich the content of two different websites – Artist’s Books Online and the Old Bailey Online.

Both of these projects make use of Text Encoding Initiative standard to mark-up the the content of their websites. HTML, as we have seen before, is a basic mark-up language which defines the layout and appearance of a text. TEI guidelines make use of XML, and define the semantic content of a text, making use of an extensive set of descriptive tags. The purpose of this to make texts more searchable, by allowing computers to make relationships between texts, and parts of a text. By marking up a text, it is transformed from a list of words into something which a computer can interpret and analyse, using the rules laid out by TEI. For example, in a play, the parts of text referring to characters and dialogue can be annotated, and using RDF triples, the relationships between these linked – which character says what to another character.

The legally allowed categories by which the elements and attributes of an XML document can be annotated is defined by the DTD (Document Type Definition). The DTD for Artists’ Books Online is available to view, and it lays out all the possible elements and attributes of the books which must be described – some are compulsory, others are optional. There is a sample of how this translates into the XML mark-up for a particular book, but there is no option to view the XML for each artists’ book in the collection, the XML is simply in the background of the website.

abo markup

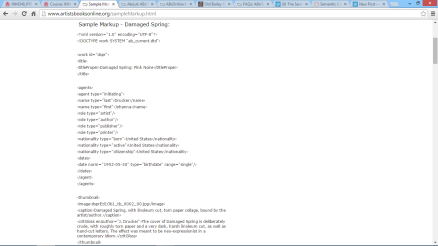
Comparison of the XML and HTML views of “Damaged Spring”

abo damaged spring

With Old Bailey Online, it is much easier to access the XML version of each document – there is a button at the bottom of each trial record to switch from HTML to XML. Old Bailey Online doesn’t make its DTD explicitly available, though they do state which catagories of information hav been marked up in the XML:

  • * Crime (divided into 9 general categories and 56 specific types)
  • Crime date
  • Crime location
  • Defendant name
  • Defendant status or occupational label
  • * Defendant gender
  • Alias names used by the defendant and the victim
  • Defendant location
  • Victim name
  • Victim status or occupational label
  • * Victim gender
  • Judges’ names
  • Jury names
  • Other person names (see below)
  • * Verdicts (divided into 4 general categories and 23 specific types)
  • * Punishments (divided into 6 general categories and 26 specific types)
  • * Defendant’s age (only regularly provided for convicts from 1789)
  • Advertisements

* Tagged fields labelled by an asterisk can be tabulated statistically.

obo html obo xml

Comparison of HTML and XML views

What I find interesting about the difference between the two is how the mark-up is applied to the documents in both websites.

Artists’ Books Online have openly published their DTD, as the books submitted are manually annotated, whereas the trial proceedings on Old Bailey Online were marked up using a combination of automated and manual mark-up methods. For example, the 1674-1834 trials were run through an automated mark-up program GATE (developed by the University of Sheffield), to detect names within the text and was able to identify approximately 80-90%. Automated methods clearly represent huge savings in time, especially for a corpus as large as the Old Bailey trials, but they still have to be supplemented by very labour-intensive manual checking.

As the project website states, marking-up a text is not a neutral activity, but “represents the imposition of a modern layer of interpretation onto these texts, reflecting the historical understanding of project staff in the early twenty-first century”. As with any digital technology, the human decisions behind the scenes will impact on the outcome for a user, and as information specialists we must always try to understand how these may affect the results we are seeing – whether from searching a historical database, or a Google.

Searching for Crime in the Library

Saturday, November 29th, 2014

In this week’s lab session we took some small steps into the world of big data, testing out a couple of text mining tools being used to explore archives of historic documents.

The text mining is a subset of data mining, which is the extraction meaningful information from large bodies of data by statistical methods, taking advantage of the power of computers to process volumes of data far greater than would be possible by a human. The aim of many text mining projects is not simply to find words in a large body of text, but to get the computers to “understand” the text, so that they can automatically detect topics, create annotations, correct mistakes…

And, focussing as it does on text, the computers have to grapple with the decidedly human complexities of language- semantics, double meanings, different languages, errors etc. To do this, computer scientists have to come up with ways of approximating human thinking through statistical models. Ultimately, the aim create machine learning, so that the algorithms can build up a knowledge-base and incrementally improve their own performance.


Lab Exercise

Given the complexity of the underlying computer science, I was interested to see how text mining could work in practice, and in what ways it allows a corpus of text to be investigated and explored. To do so, we compared the Old Bailey Online archive, with one of the Utrech University Text Mining research projects.

As we had seen in a previous lab session, the Old Bailey Proceedings Online  allows acces to the digitised archive of over 197,000 Old Bailey court records, spanning 1676-1772.

I performed a search using the API Demonstrator for the keyword library, which came up with 361 hits. From this I drilled down further by offence category of killing, which took it down to 25 hits. Unfortunately, all the trials simply mentioned libraries at some point in the proceedings -none of the murders actually took place in libraries!

obo library murder


What is useful about the API search compared to the standard search is that the results can easily be exported to other applications for further analysis. The integration with Voyant tools is especially easy to use, the power of APIs allowing the two applications to seamless export data without the user having to have any programming skills – all you have to do is press a single button.

voyant library murder


From the Utrecht text mining projects, I chose to look at Circulation of Knowledge and Learned Practices in the 17th-century Dutch Republic (CKCC), as not only was the subject interesting, but unlike most of the other projects, the text mining tool they have developed was already available for anyone to use on the website.

The primary means of disseminating scientific knowledge in the 17th century was not through journals, but by letters sent between scientists. In order to find out the patterns of knowledge circulation this mode of communication created, the CKCC project have developed a web application called ePistolarium – which allows researchers to “browse and analyze around 20,000 letters that were written by and sent to 17th century scholars who lived in the Dutch Republic.”

Like the Old Bailey Online, the ePistolarium goes beyond just searching and browsing its corpus by allowing visualizations, (though this function is integrated within the application itself, rather than exporting). This can create graphic representations of the patterns of correspondance, based on “geographical, time-based, social network and co-citation” relationships.


I searched for the two scientist, Isaac Newton and Gottfried Leibniz (using the search query newton AND leibniz), as the controversy over which of them first invented calculus would have been a hot topic in the scientific community during the period of the corpus.


epistolarium results

There were 16 results from this search – less than I had expected – but plenty to do some further investigation of what ePistolaium allows you to do with the data.


epistolarium topic modelling

You can open each letter and read the contents – which are the result of OCR digitised original documents. Within the letters there are numerous interesting features, such as higlighted names (which give further biographical details where hovered over), keywords and similar letters. This extra annotaion is all the result of automated text mining techniques, such as topic modelling and keyword analysis – more about how these techniques were applied can be read in the methodology section of the project website.

epistolarium csv

The results can be exported as a CSV file, which would allow researchers to further analyse the results in external applications. It does however only export the metadata (date, sender, location, etc) not the content of the letters, so I’m not sure how you would perform text analysis using Voyant.

Below are three of the visualisations available – timeline, co-citation graph and geographical map.

epistolarium timeline

epistolarium cocitation

epistolarium map


It is interesting how this project is created in collaboration between historians and computer scientists. The outcome of all the Utrecht text mining projects seems to be a feedback loop between answering the historical research questions and developing and refining the tools to do so.

Head in the Word Clouds

Sunday, November 23rd, 2014

In this week’s lab session we “screwed around” with text analysis tools – playing around with three different tools to see what they could do: Wordle, Many Eyes and Voyant.

The power of these tools – even the humble and often despised word cloud -is that they create new versions of a text, which can uncover patterns, meanings and relationships within texts that would not obvious by traditional “close reading” – condensing a large corpus of text in a single view.

Wordle – the simplest of the three tools, has a bad reputation, but I found that it provided a quick and clear overview of the main themes within a text, and that the word clouds are quite self-explanatory to any viewer. It comes with a pre-set stop word list, and individual words could be removed from the chart . For example I removed #citylis, as this appeared in every tweet in the #citylis dataset, so it dwarfed all the other results, making them unreadable.

citylis wordle

From the visualisation of the #citylis twitter archive, the most dominant element is “RT”. I could have taken this out, all with “MT” and “via”, as they are are essentially metadata – but they reveal much about the patterns of communication within Twitter. The next biggest elements are the handles of the top tweeters, followed by “bl” and “labs” referring to the British Library Labs- showing the success of Twitter backchannels as a way of  extending the discussion of a live event beyond the room.

Wordle: #citylis

Wordle also had the option to embed a link to the original wordle, though unfortunately it only appears as a thumbnail within the blog

The second tool we tried, Many Eyes, was incredibly frustrating – it did seem to have quite a lot more functionality than Wordle, with the option for various different types of visualisation – but it was so slow and glitchy that it was essentially unusable. Here is a bubble chart visualisation of my Altmetrics data set. Many eyes did not seem to have a stop word list, so I had to remove words individually – which took several minutes per word! It was a shame that I couldn’t properly test this site out, as the it had the widest variety of visualisations, which could each be appropriate for different tasks, though the ability to manipulate and clean the data does seem quite limited.

many eyes

The final tool we tried was Voyant, developed by Geoffrey Rockwell a proponent of Digital Humanities, it is by far the most powerful and flexible tool, capable of performing some quite insightful analyses of texts.

Voyant offers a word cloud tool – which can be more finely controlled than Wordle in terms of stop words, but less so in terms of layout and design. Beyond the word cloud, Voyant can list words by frequency, show keywords in context and display the entire text. It also has the ability to embed or export, so that you can share you’re workspace and dataset with others. The embedding feature didn’t seem to be compatible with WordPress, but I was able to generate a URL http://voyant-tools.org/?corpus=1416668356850.3641&stopList=1416677454924ki

The feature I liked the most was Word Trends. As the Twitter data set was in reverse chronological order, you are able to get an idea of relationships between words in time – to see if certain words were trending together.

citylis voyant

For a list of all the Voyant tools, including several not included in the standard view: http://docs.voyant-tools.org/tools/

Next session, I am looking forward to looking at ways of examining text on a larger scale – quantities beyond what could be read within a single lifetime, and how meaningful patterns could be extracted by linking text to date and location data.

Some thoughts on altmetrics

Monday, November 17th, 2014

Last week in the lab session we had the opportunity to explore Altmetric Explorer, and consider how tools like this represent a significant shift in academia and beyond.

Academics and the bodies who fund them have always sought to measure the impact of their research output – how widely read it is; how it forms part of a discourse; what further research it generates; how it adds to the prestige of an individual or institution. Where traditional ways of measuring this, such as citation counts and journal impact factors, have tended to take a long time to accumulate and asses, and been focused within academic circles, much of the excitment surrounding altmetrics is their speed and reach beyond academia.

Altmetrics guages the attention individual articles are receiving through mentions on various social media channels – including Twitter, blogs, Facebook and news outlets – which are then weighted by volume, source and author. This gives the ability to monitor in realtime what how attention and what is being said about a particular article, subject or journal.

To test the imediacy of Altmetric, I decided to perform a search for mentions in the last week of “Philae” – the first spacecraft to land on a comet, which took place earlier this week.

philae altmetric

The top two articles garnered quite a large score within just three days of being published, and as you can see in the “donoughts” below, the attention has been generated almost exclusively through Tweets, whereas most of the attention of the third most popular article was driven by mentions in news outlets.


philae top 3

What I would have liked to have been able to do, but was not able to find easily how to do, would be to track the level of attention a topic or article receives over time in graphical form. This would be useful to see if there were correlations between the interest in particular subjects and the media attention they receive – and if this popularity feeds back into the type of research being undertaken.

As mentioned by many of my classmates’ blogs, there are some limitations Altmetric:

  • a heavy bias towards science, with little coverage of arts or humanities. This is perhaps a question of lack of awareness within these fields of ways to make research trackable by services such as Altmetric
  • altmetrics are not intended to replace traditional bibliometrics, but rather to complement them.
  • the stylish presentation could seduce people into not looking beyond the simplicity numerical score – the score is not a measure of quality, but rather of attention – and the context of that attention must be considered for each individual case.


The potentials of Twitter analytics

Sunday, November 9th, 2014

What struck me about last DITA session’s lab exercise was the immediacy of Twitter-metrics, and how you can trace the spread and impact of topic in real time. I am looking forward to delving deeper into the data we gathered, and learning more about altmetrics as a complement to more traditional research methods.

As someone who is fairly new to the idea of using social media in an academic context, I have to admit that I am both excited by and wary of this – excited by the speed and scope of potential analysis, but wary of ability to maintain relevance and quality of data. Used badly, social media analysis has the potential to be misleading or gimmicky, used well altmetrics are an extremely powerful tool for information professionals.

“Donald Rumsfield’s theory of knowledge”

Tuesday, October 21st, 2014

The slightly circular nature of the discussions about knowledge in yesterday’s session show how hard a concept it is to get your head around – whether a lack of information can create knowledge; if something has to be observed to be known; the distinction between true and untrue information and the intention behind it etc.

All this reminded me of  reminded me of the much pilloried 2003 speech by US Secratary of Defence Donald Rumsfeld defending the intention to invade Iraq because of WMD, despite a lack of evidence for them.

Reports that say that something hasn’t happened are always interesting to me, because as we know, there are known knowns; there are things we know we know. We also know there are known unknowns; that is to say we know there are some things we do not know. But there are also unknown unknowns — the ones we don’t know we don’t know. And if one looks throughout the history of our country and other free countries, it is the latter category that tend to be the difficult ones.

Despite the awkward tautology and dubious intent of this statement, Rumsfeld makes an interesting point about different types of knowledge. However, according to philosopher Slavoj Zizek, Rumsfeld “forgot to add was the crucial fourth term: the “unknown knowns,” things we don’t know that we know […] the disavowed beliefs, supposi-tions, and obscene practices we pretend not to know about, although they form the background of our public values.”

What is interesting in an information science context, is that the decisions of world importance are being made on the basis of knowledge without a basis in documented information which we deal with: “unknown unknowns” – lack of information, and “unknown knowns” – suppressed knowledge.

Otlet vs Google

Sunday, October 19th, 2014

4421486961_000c1f9814_b
Just some quick thoughts about how the similarities and differences between Google’s search bar and Paul Otlet’s Mundaneum really struck me.

If the Mundaneum existed today, and it really had become the repository for all the world’s knowledge- what would it look like; how would you search it; how would it have evolved over the years?

More to follow…


Part 2. The Semantic Web – the realisation of the Mundaneum?

Following this week’s session on the Semantic Web, Encoding and Annotating, it seemed like a good opportunity to revisit this brief post about Paul Otlet’s prefiguring of the modern-day Web: the ways in which it is different (and poorer?) than his vision, and whether the Semantic Web could create Otlet’s “mechanical collective brain”.

Inspired by the emerging communication technologies of telephone, cinema, microfilm, Otlet imagined a futuristic machine, the Mondotheque, which would give access to all the documents ever created, forming a “reseua mondial” (international network) of knowledge sharing and creation – an uncanny prophecy of modern computer networks.

The power of Otlet’s dream was not just having access to individual document – it was how they could be linked, using Otlet’s classification system, the Universal Decimal System. Unlike Dewey Decimal System, which places documents within defined classes, the UDC is not only able to combine classes, it can express relationships between them through a precise syntax of connecting punctuation. This is where Otlet and the Semantic Web align – by adding metadata to links between (and within) documents, new meanings arise out of these connections.

In terms of information retrieval, this should herald a huge improvement in search engines’ ability to return relevant results, in that they would not only search for keywords, but they would be sensitive to the meaning and context of a query. The ultimate semantic search engine would not return a list of results, but be able to follow a chain of associations to provide a single answer, aggregated from all available sources.


However, there is another parallel between Otlet, which could be a warning sign to the Semantic Web movement. This extract from an interview with Alex Wright (author of the excellent biography of Otlet Cataloging the World) explicitly points to the similarities between Otlet and Semantic Web:

[Alex Wright] – […] For all its similarities to the web, Otlet’s vision differed dramatically in several key respects […] Most importantly, he envisioned his web as a highly structured environment, with a complex semantic markup called the Universal Decimal Classification. An Otletian version of Wikipedia would almost certainly involve a more hierarchical and interlinked presentation of concepts (as opposed to the flat and relatively shallow structure of the current Wikipedia). Otlet’s work offers us something much more akin in spirit to the Semantic Web or Linked Data initiative: a powerful, tightly controlled system intended to help people make sense of complex information spaces.

Though being “powerful”, Wright seems to be equating Otlet’s and Semantic Web approaches with highly centralised, top-down systems of social organisation, in which a few people perform the time-consuming task of annotating and linking knowledge. In the face of the vast scale of the Web, and the ease of uploading content that people have become used to, would people outside of specialised fields be willing to spend the time annotating content to fit within highly controlled ontologies? Quite a few of the projects we have looked at in the lab sessions seem to rely on this intensive, almost-hand made level of human classification, which are effective for the scope of the projects, but less so on a global scale. Large scale automated tagging and annotation will probably be feasible in the future, but similar questions will remain – who decides upon and controls the metadata created?


(Original post 19 October, added to 03 December)

Information Fashion Architecture Taste

Saturday, October 11th, 2014

I named this post after the (now defunct) architectural firm Fashion Architecture Taste, because I wanted to consider the presentation of information architecture as something highly subjective, subject to the whims of fashion and taste, and in turn class and politics.

When  trying to choose a template for my blog, from 165 free ones available, I was initially looking for ones with a contemporary feel. White backgrounds, simple layouts, maybe a few bold colours to strategically draw the eye – something which looked “clean”, “neutral” and “tasteful”, so that the content of the blog could speak out for itself without being overshadowed by the form.

But, as we discussed in class, the terms we use to describe and organise the information are culturally constructed, so there is no such thing as a “neutral” website. Our choices information organisation and presentation are informed as much by fashion and taste as by our desire for legibility and clarity.

When I saw “Retro MacOS” theme it reminded me of the first two website from the lab exercise in session one, looking dated and slightly clunky, though even more so as it simulates the pre-www Macintosh display. And yet ironically is a thoroughly modern  example of web2.0, which looks the way it does to simultaneously provoke nostalgia and be ironic.

I may change the look of my blog for the next post, though it may be difficult to find a form that reflects the content for each post!